Add data to diagrams in Visio 2007 Microsoft Office Visio 2007 Step by Step By Judy Lemke a...
Add data to diagrams in Visio 2007
Microsoft Office Visio 2007 Step by Step
By Judy Lemke and Resources Online
Judy Lemke specializes in documentation and training for Microsoft Office Visio. She is an award-winning writer with more than ten years of experience writing, editing, and designing everything from developer documentation and tutorials to product manuals and marketing collateral. Judy can be contacted through her Web site at www.judylemke.com.
To learn more about other books on the 2007 Microsoft Office system, visit Microsoft Press.
In this article
When you see a professional-looking Visio diagram, the advantages of diagramming, rather than just conveying information using words and numbers alone, are evident. Now, with Microsoft Office Visio Professional 2007, you can take the power of diagramming even further by integrating data with diagrams to convey more than words, numbers, and data alone. This article provides a brief introduction to the new Data Link and Data Graphics functionality included in Office Visio Professional 2007. These new features enable you to integrate and visualize data with any Visio diagram—flowcharts, value stream maps, network diagrams, block diagrams, timelines, and so on. By integrating data with diagrams, you can convey not only the visual aspects of a system or process, such as the equipment in a network or steps in a process, you can also visualize data trends for each component — all in one Visio diagram.
Visualize data in diagrams
To visualize data in diagrams, you follow these basic steps:
-
You link a diagram to one or more external data sources, such as a Microsoft Office Excel workbook or Microsoft Office Access database.
-
You link the data to shapes in the diagram to display the data with the shape it's linked to on the drawing page. For example, IP address, Manufacturer, and Model data might appear with computer shapes in a network diagram. Input, output, and completion time data might appear with steps in a process diagram.
-
You create your own data graphics — Visio shapes designed specifically for visualizing data — to visually track data trends, flag issues, and identify problems in the diagram. Data graphics are a combination of text, progress bars, icon sets, data flags, and so on that you choose from to effectively track the data you want to track in your diagram. For example, show the number of people it takes to complete a step by using people shapes, indicate the percentage complete for a step by using a progress bar, or change the color of a shape when the value of a data field changes.
Step 3 is optional, but recommended; after you link data to shapes in a diagram, Office Visio Professional 2007 creates a few basic data graphics to display the data on the drawing page, so you only need to perform this step if you don't want to use those basic data graphics. However, to create effective diagrams, you'll probably want to create your own data graphics, which is easy. In minutes, you can specify which visual elements to use for each data field, where to position the elements, and so on. Then, Visio Professional creates your custom data graphic for you.
-
You refresh the diagram when the data source changes, so you can visually track data changes over time in your diagram.
Tip: Office Visio Professional 2007 includes sample diagrams that are integrated with data, so you can see professional-looking examples of data graphics and how you can visualize data in your diagrams.
Using various data features in Visio 2007
All the new Data Link and Data Graphics features that enable you to link diagrams to external data sources and visualize data on the drawing page are included in Office Visio Professional 2007, but not in Office Visio Standard 2007. These new features don't replace any functionality in previous versions of Visio. Any diagrams and solutions created using previous functionality will continue to work.
Using Office Visio Standard 2007, you can still generate diagrams from data by using templates that include various data tools and were also included in Visio Standard 2003: Organization Chart template, Organization Chart Wizard template, Timeline template, Calendar template, Gantt Chart template, and Brainstorming Diagram template. Using the data tools included with these templates, Visio generates an entire diagram for you by connecting to data, and creating the diagram from the data. Also, in Office Visio Professional 2007, you can still reverse-engineer databases by using the Database Model Diagram template — again, in this situation, you are generating a diagram from data; you are not linking an existing diagram to data. You can also generate diagrams using tools in the PivotDiagram template and Web Site Map template included with Office Visio Professional 2007.
Tip: You can still manually enter data for shapes in any existing Visio diagram using either edition of Visio 2007 by using the Shape Data feature.
Which method should you use?
-
If you want to link existing diagrams to data sources, use the new Data Link functionality.
-
If you want to generate an entire diagram from data (using templates that support this functionality), use the tools included with those templates.
You can also combine methods to create diagrams. For example, you could generate an entire organization chart using the Organization Chart Wizard template, and then link the organization chart to another data source (using the new Data Link functionality) to show other data in the diagram, such as network asset information. You could generate a database model diagram by reverse-engineering a database (using the Database Model Diagram template), and then visualize data in the model by linking an external data source to it using the new Data Link functionality.
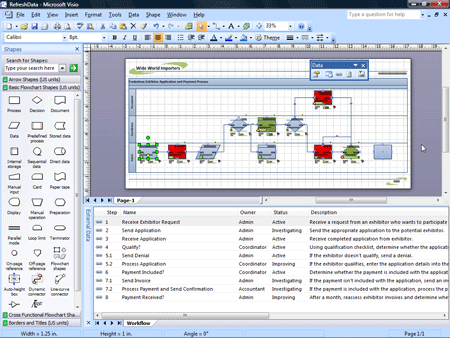
You can integrate data with a cross functional flowchart that describes an application, transforming the diagram in to a rich source of information. You link the diagram to a data source, and then link data to shapes in the diagram, which automatically displays the data with the shapes on the drawing page. You can modify and create new data graphics so you can easily visualize data trends and identify issues in your diagram. Finally, you refresh the data in the diagram after the data source changes.
Linking diagrams to external data sources
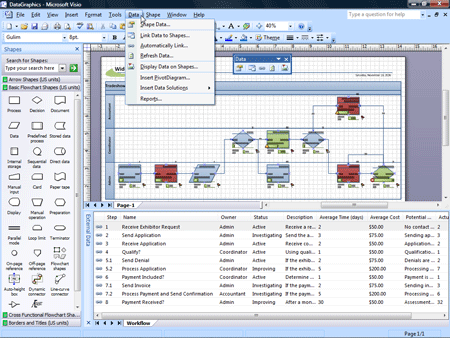
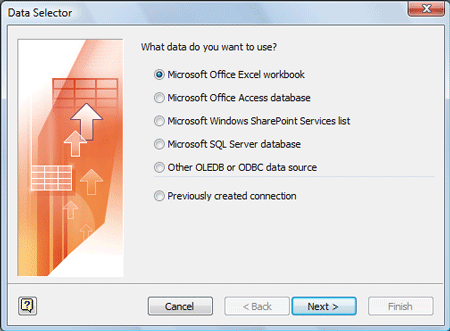
Visualizing data in your Visio diagrams begins with linking a diagram to an external data source. With Microsoft Office Visio Professional 2007, you can link any Visio diagram to one or more external data sources using the Data Selector wizard. To start the wizard, on the new Data menu, click Link Data To Shapes. Or, on the new Data toolbar, click the Link Data To Shapes button.

Tip: You can link a diagram to multiple data sources to show different types of data for the shapes in the diagram — one source might include resource information and the other technical information. Or, you can use multiple data sources to show the same data in different ways in a single diagram.
The Data Selector wizard allows you to choose from a wide range of data sources, in addition to specifying the specific data in the source that you want to link to and how to uniquely identify the data if the source changes. The wizard is quite easy to use, even if you're not a database aficionado.

After you link the Visio diagram to the data source, Office Visio Professional 2007 stores a copy of the data with the diagram, and displays the data in the External Data window.

Tip: If you link a diagram to more than one data source, the External Data window displays the data from each source on a separate tab. You can also remove a data source from a diagram by right-clicking the External Data window, pointing to Data Source on the shortcut menu that appears, and then clicking Remove. If you forgot which data source a diagram is connected to, right-click the External Data window, point to Data Source, and then click Properties to view the data source's file name and path.


COMMENTS